Fed4FIRE+ Experiments
The tutorial demonstrates the steps required to start and manage the Fed4FIRE+ experiments for executing stress tests of the Device Security Booster by simulating virtual edge devices with asvin API stack. This procedure facilitates the detailed analysis of the scalability and reliability of the platform.
Getting Started
- Starting the Experiment
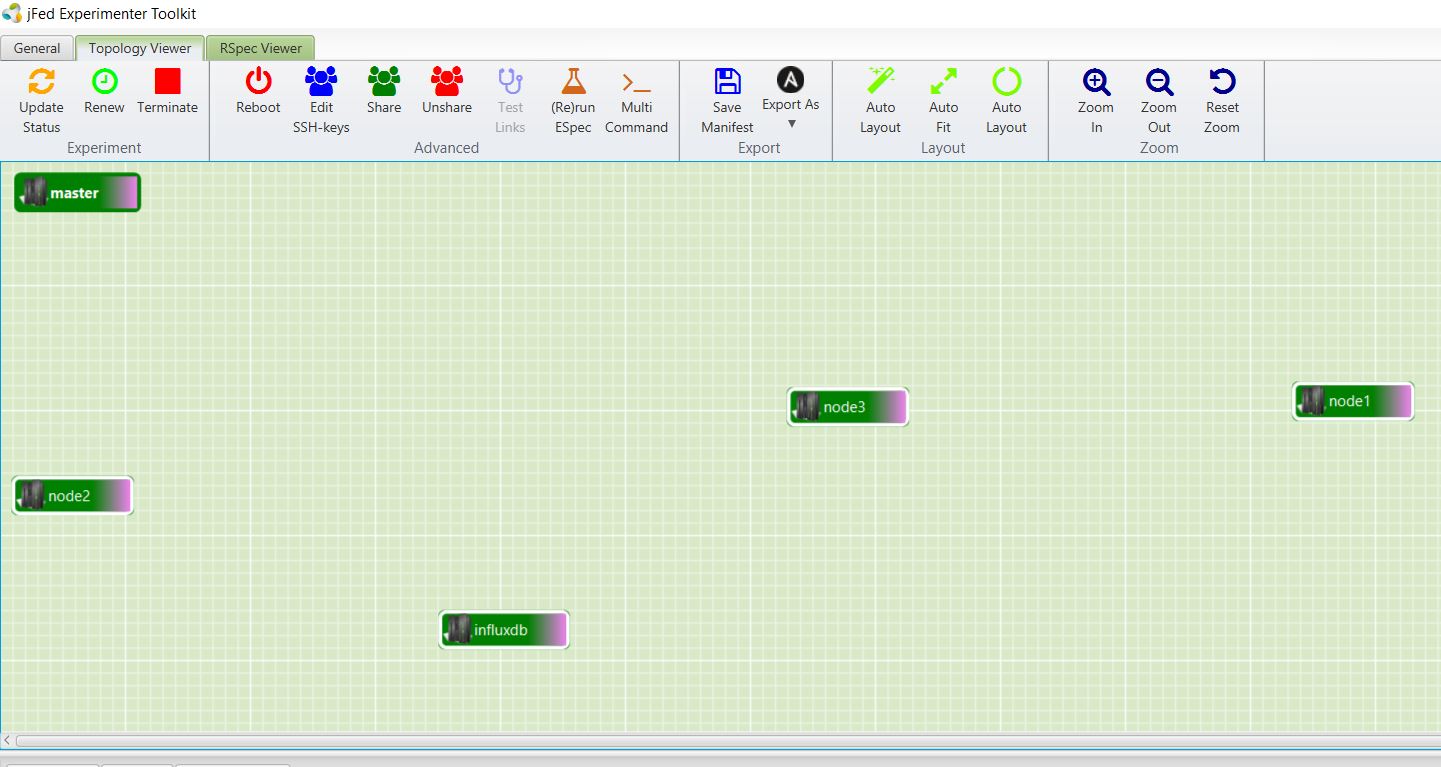
To start and monitor the Fed4FIRE+ experiments we use the jFed Experimenter Toolkit. It is a user-friendly tool with a simple and self-explanatory interface. Login to the experimenter tool with Fed4FIRE+ account. Then experiments can be created and started by utilizing the drag and drop options to form a network of nodes. Alternatively, the Experiment Specifications (ESpec) can be generated and uploaded in the toolkit to start the experiment.
To create the ESpec, the ESpec Generator tool is needed which is available in ESpec Generator Github repository. This tool can be used to generated ESpec for only Virtual Wall1 and Wall2 testbeds. It includes all the installation scripts of Kubernetes cluster, influx DB and other tools which are required for the stress test of the platform.
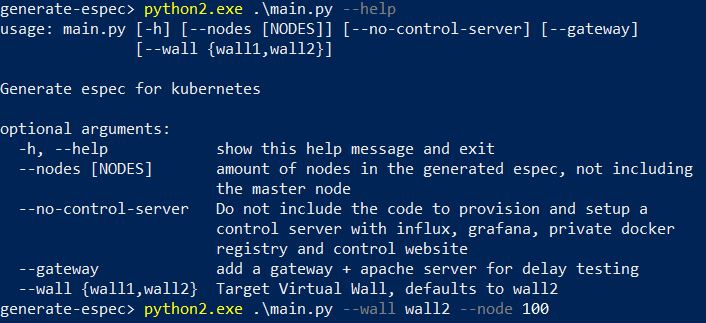
Before running the ESpec generator, the python requirements have to be installed by running the line below in the generator folder.
pip install -r requirements.txt
Using the generated ESpec, one can start the experiment on Fed4FIRE+ testbeds. The experiment will have a master node, influxdb node, and all other worker nodes. If ESpec is generated for 5 nodes, then the experiment will have a master node, influxdb node, and 5 worker nodes running.
To reserve more than 15 nodes in an experiment, it is advised to inform the Fed4FIRE+ team before initiating the experiment.
- Setting up Control Server
After successfully starting the experiment with a Kubernetes cluster, the user shall download the control server from the Experiment-webserver Github repository and deploy it on the master node of the Kubernetes cluster.
Follow the steps given in the repository. Then the control server website will be accessible by going to the public IPv6 address of the server.
- Deploying asvin API stack image
The example python code running the API stack for simulating the edge device is provided in asvin Github repository. The user has to provide the credentials for the Blockchain server and IPFS Login, User Key and Device key in the UserDetails.json file.
The image takes 2 user inputs:
Number of threads to run
The server (production or staging)
By default it starts with 1 thread and uses staging server details
Files asvincurl.py and Dockerfile are zipped together to .tar.gz
tar cvfz asvin_stage2.tar.gz asvincurl.py Dockerfile
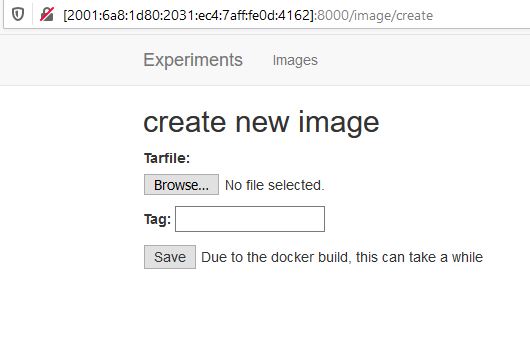
The control server has a web interface through which the user can create a docker image using the tar file generated, which will then be deployed to the Docker registry.
- Monitoring the Experiment
In the Experiment Monitoring interface, a new experiment can be created using one of the Docker images from the Docker registry.
While creating the experiments, you should provide the runtime arguments for the python code. Otherwise, the code runs with the default arguments as mentioned previously. Also, the user should mention the number of pods (parallels) to run on the Kubernetes cluster.
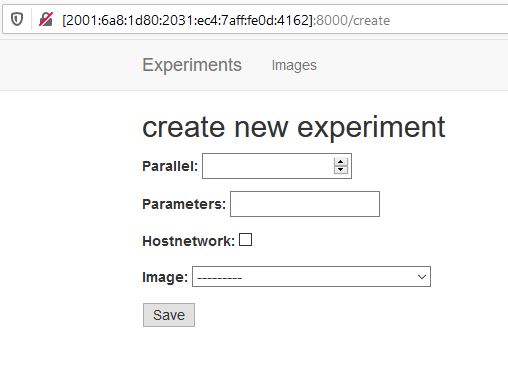
The number of parallel pods running on the cluster can be changed anytime while the experiment is running.
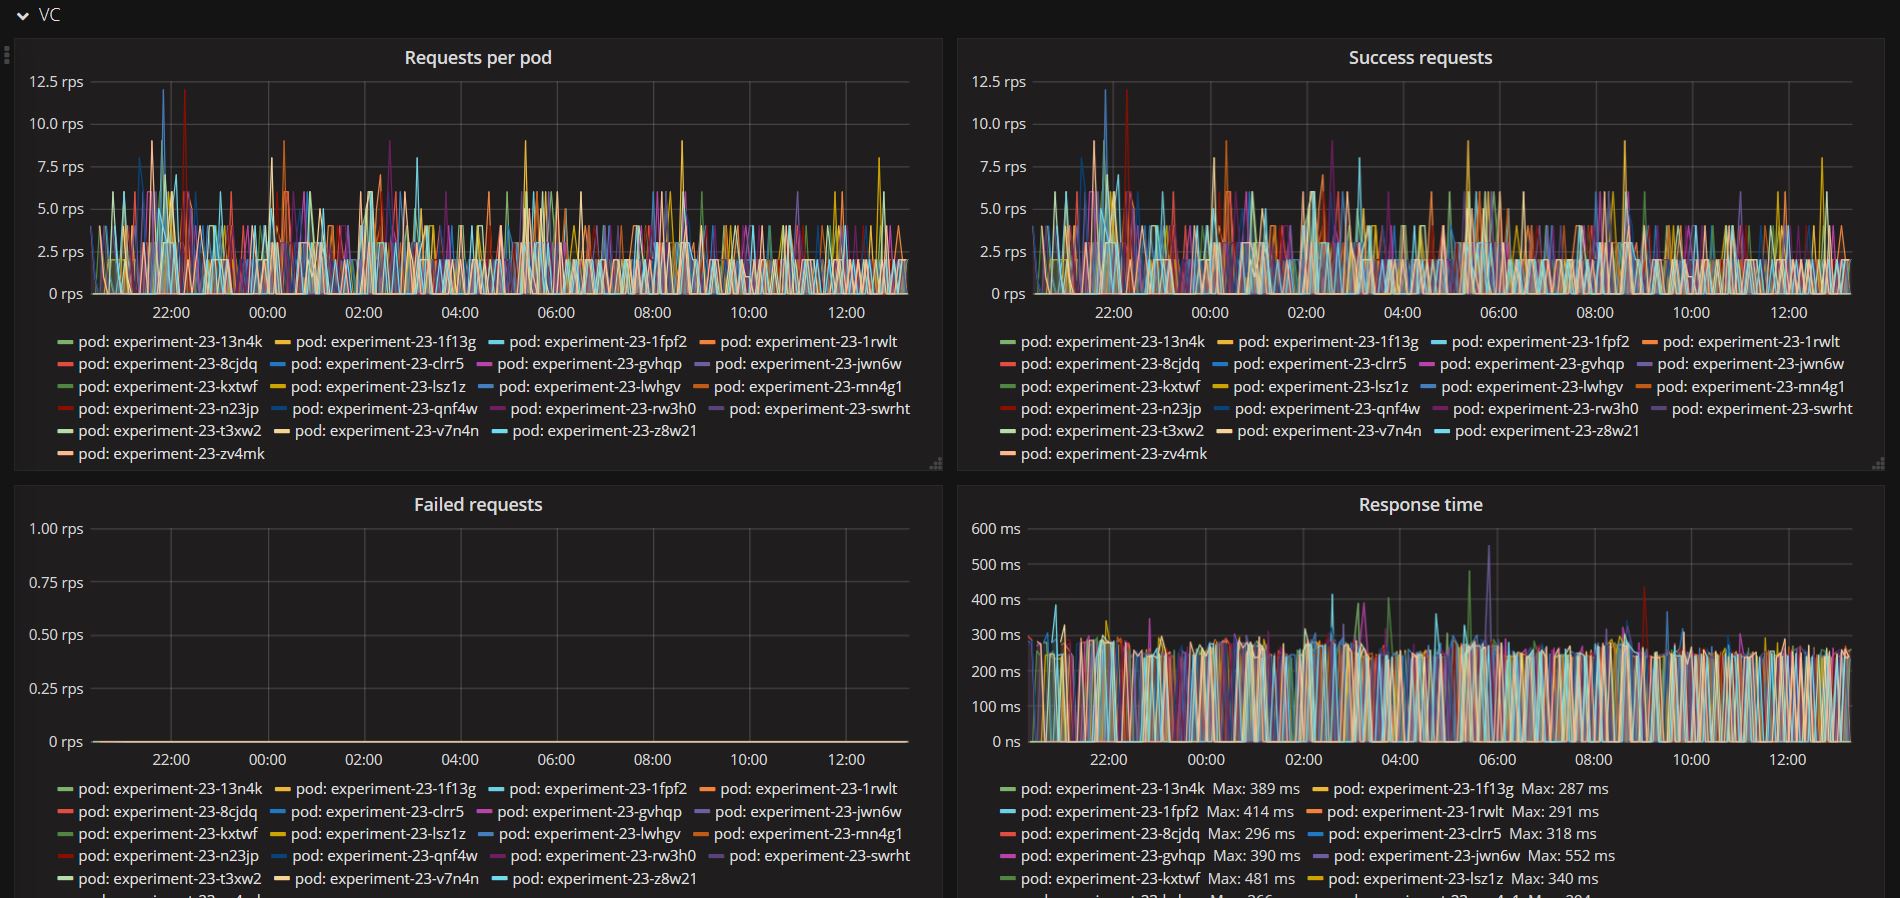
- Analysis of results in Grafana
The asvin API stack image running in the experiment saves the following values in the influxdb server.
Total requests to Version controller, Blockchain, and IPFS servers
Total successfully served requests from Version controller, Blockchain, and IPFS servers
Total failed requests from Version controller, Blockchain, and IPFS servers
Response times of each requests to all 3 servers
Successful firmware updates
In Grafana, these values are fetched from the influxdb server and visualized as time-series graphs to analyze the robustness of Device Security Booster. The sample json file can be used to create a Grafana dashboard.